TrySolitaire Half-Year Report: 215,359 Games, and What Changed
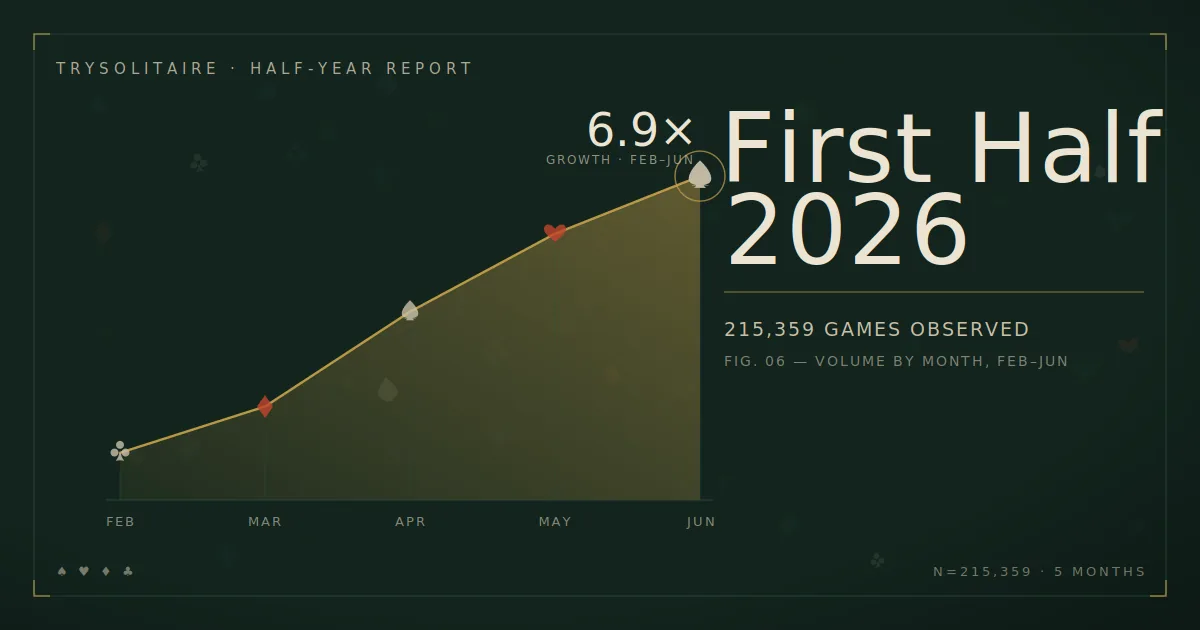
TrySolitaire Half-Year Report: 215,359 Games in the First Half of 2026
Published: July 2026 Data period: February 1 – June 30, 2026 Sample: 215,359 games started, across 23 game variants Reports in this series: February · March · April · May · June
We’ve published a report every month since February. This one looks at all five together.
In that time TrySolitaire went from a small site to one that sees more than 75,000 games a month. But the growth isn’t the most interesting part. The most interesting part is what people played. In February, this was a Klondike site. By June, it wasn’t — not because Klondike shrank, but because everything else grew up around it.
Here’s the first half of 2026 in numbers.
The Big Number
215,359 games started. 68,246 won.
That’s the first half of the year, February through June. A note on the window: our tracking only started on January 29, so January is two days of data and we’ve left it out. When we say “the first half,” we mean the five full months we can actually measure.
Of the games that reached a clear ending, players won a little under a third. We’ll come back to the win rate — there’s a wrinkle in comparing it across these five months, and it’s worth explaining properly rather than putting a single number on the whole period.
The Growth
| Month | Games | Growth |
|---|---|---|
| February | 11,064 | — |
| March | 21,903 | +98% |
| April | 44,117 | +101% |
| May | 62,398 | +41% |
| June | 75,877 | +22% |
The site grew 6.9x in five months. It doubled in March. It doubled again in April. Then it stopped doubling.
That’s not a warning sign. Each month is still the biggest we’ve had, and June added more games than any prior month. But the shape changed — from doubling to steady, strong growth. A site that doubles two months running is catching a wave. A site that grows 20-40% a month after that is building something people come back to. The second pattern lasts longer.
What Actually Changed: Klondike Stopped Being the Whole Site
This is the real story of the half-year, and it’s a share story, not a volume story.
Klondike’s share of all games played, month by month:
| Month | Klondike Share |
|---|---|
| February | 76% |
| March | 79% |
| April | 81% |
| May | 61% |
| June | 50% |
Klondike climbed to 81% of the site by April. Then it fell to 50% by June — a 31-point drop in two months.
Here’s the part that matters: Klondike didn’t lose any players. Its raw volume went 35,848 in April, 38,012 in May, 37,846 in June. Flat. It held every game it had. The share fell because everything else grew faster — a lot faster.
In February, if you played a game on this site, three times out of four it was Klondike. In June, it was a coin flip. The site didn’t move away from Klondike. It grew a second half that isn’t Klondike at all.
What Grew: FreeCell Went 37x
The game that did the most to change the mix was FreeCell.
| Game | February | June | Growth |
|---|---|---|---|
| FreeCell | 291 | 10,827 | 37x |
| Mahjong | 444 | 9,081 | 20x |
| Spider | 734 | 10,159 | 14x |
| 2048 | 24 | 773 | 32x |
| Pyramid | 208 | 1,493 | 7x |
| TriPeaks | 329 | 1,781 | 5x |
FreeCell was a rounding error in February — 291 games, less than Golf. By June it was the second most-played game on the site, behind only Klondike and ahead of Spider. It grew 37x.
Most of that happened in two months. FreeCell sat under 700 games a month through April, then jumped roughly 10x in May and nearly doubled again in June. Two things drove it: the game started ranking better in search, and a wave of players arrived from China. Both are real and organic. FreeCell earns its own full write-up soon.
Spider deserves a mention too — it grew every single month without a stumble, 734 to 10,159, and now sits at number three. It’s the quiet, steady climber where FreeCell is the breakout.
So the diversification wasn’t one game. It was FreeCell leading and nearly everything else rising behind it, all at once, while Klondike held its ground.
Win Rates: The Real Baselines
We fixed a tracking bug on April 14 that had been undercounting abandoned games. Before that fix, win rates read higher than they should have, because games people quietly walked away from weren’t all being counted.
That means we can’t put one win rate on the whole six months. February through April are measured differently than May and June. So instead of a blended number that mixes two tracking methods, here are the clean baselines from May and June — two full months after the fix, on large samples:
| Game | Win Rate | Games |
|---|---|---|
| FreeCell | 57.7% | 17,069 |
| Spider 1-suit | 55.8% | 11,147 |
| Mahjong (Turtle) | 51.3% | 7,661 |
| TriPeaks | 39.2% | 2,496 |
| Sudoku | 34.6% | 2,382 |
| Spider 2-suit | 31.3% | 5,456 |
| Pyramid | 30.0% | 2,045 |
| Klondike Draw 1 | 27.9% | 58,310 |
| Spider 4-suit | 21.8% | 2,141 |
| Golf | 12.6% | 1,824 |
| Klondike Draw 3 | 11.5% | 17,548 |
A few of these are now solid enough to treat as settled. Klondike Draw 1 wins 27.9% of the time across 58,310 games — that’s about as firm a number as we’ll ever have for a solitaire game. Draw 3 wins 11.5%. If you play Klondike here, those are your real odds.
FreeCell leads the site at 57.7%. It’s a game where almost every deal is solvable, so a high rate makes sense — winning usually means you found the path, not that you got a good deal.
Spider’s difficulty spread holds firm. 1-suit 55.8%, 2-suit 31.3%, 4-suit 21.8% — a 2.5x gap between the easiest and hardest setting, steady across the whole clean sample. Same pattern we found in the spring, now on more games.
Mahjong Turtle wins 51.3%, with the same caveat we always attach: Mahjong lets you reshuffle the board up to five times by default, which raises its rate compared to card games that have no such option. It’s not directly comparable to Klondike or Spider.
What We Learned: Most Games End in Someone Leaving
The biggest thing we learned this half wasn’t about any one game. It was about how games end.
For most of the year we reported win rates and treated everything else as “not a win.” When we fixed our tracking in April, May and June let us split that open — and the split was surprising.
Across the open-ended games, here’s what happens after someone starts:
| Game | Win | Abandon |
|---|---|---|
| FreeCell | 57.7% | 42.3% |
| Spider | 44.8% | 55.2% |
| Sudoku | 33.5% | 66.5% |
| Klondike | 24.1% | 75.9% |
Klondike gets abandoned three times out of four. FreeCell only two times in five. The pattern is a mirror: the games people finish are the games people win.
And losses barely exist. In Klondike, across 75,858 games in May and June, players recorded a completed loss three times. FreeCell: zero. Spider: three. The reason is mechanical — in an open-ended game, you don’t lose, you get stuck. The board just sits there. You leave. So a game you didn’t win shows up as an abandon, not a loss.
That’s why win rate remains the number we trust most. It’s the one measure that stays fair whether a game ends by declaring a loss or by someone closing the tab.
What’s Next
Two things change the second half of the year.
First, we’ve consolidated. Our sister sites for Mahjong and Sudoku were retired earlier this month and now point to TrySolitaire directly. For six months our data quietly mixed traffic from those sites into a few games’ numbers — small, always disclosed, never card games. That’s over. From here on, every number is TrySolitaire and only TrySolitaire.
Second, that cleanup unblocks the posts we’ve been holding. A full look at what winners do differently, whether undo actually helps, and deep data portraits of Klondike and FreeCell — all of it needed clean, single-site data we didn’t have until now. Those are coming.
Six months in, the picture is clear. The site grew almost sevenfold, stopped being a one-game site, and taught us that most solitaire games don’t end in defeat — they end in someone walking away, usually from a Klondike deal that wouldn’t break.
The most-played game of the first half was Klondike, holding exactly half the table by June. Play it here →
Or try the game that grew 37x. Play FreeCell →
All data is anonymous. TrySolitaire does not track individual users. Win rates are calculated as wins divided by total starts (treating abandons as non-wins). Data covers February 1 – June 30, 2026; January is excluded because tracking began January 29. Win rate and abandonment figures are drawn from May and June only, the two full months after our April 14 abandon-tracking fix; earlier months undercounted abandoned games and are not directly comparable. Volume, growth, and popularity figures cover the full February–June period. Mahjong allows up to 5 reshuffles by default, which raises its win rate relative to games without that option; only the Turtle layout is reported. TriPeaks, Golf, and Pyramid each include a smaller “standard” sub-variant we are still characterizing; their rates are the game-level blend. June figures include roughly 1.3% of starts from now-retired sister sites (Mahjong and Sudoku only, no card games). For game rules and strategy, see our Klondike Solitaire Guide, FreeCell Guide, and Spider Solitaire Guide.
Published July 2, 2026 | TrySolitaire Blog · Play Free Solitaire