TrySolitaire August 2026: What 147,673 Games Tell Us
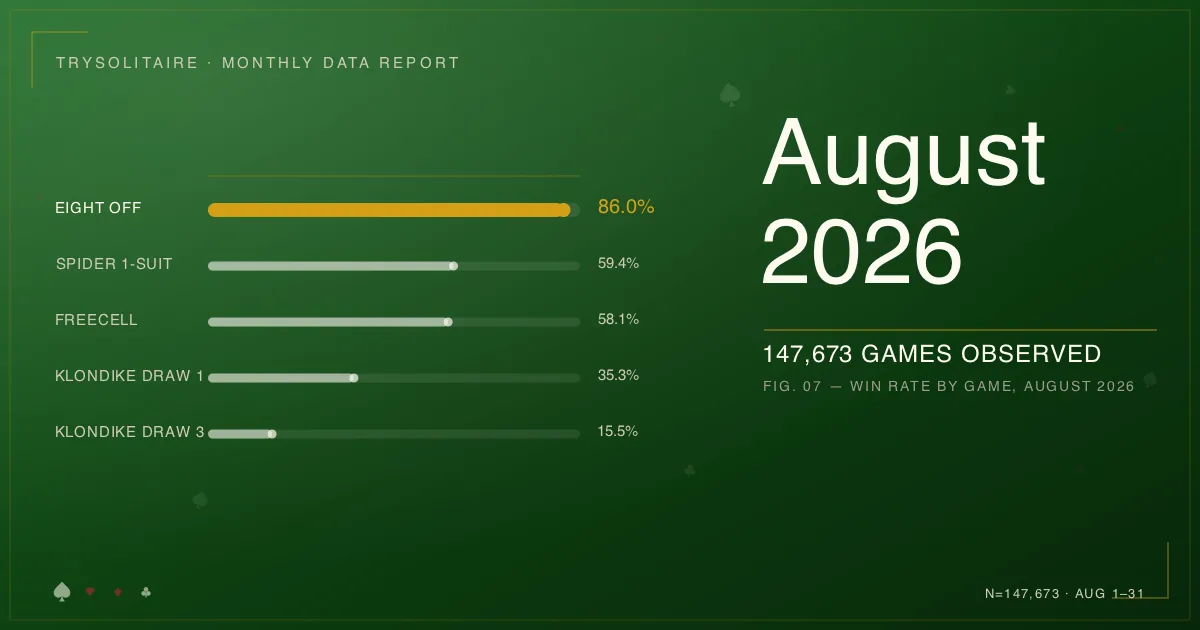
TrySolitaire Monthly: What 147,673 Games in August 2026 Tell Us
Published: September 2026 Data period: August 1–31, 2026 Sample: 147,673 games started, across more than 70 game variants Previous report: June 2026 →
We did not publish a standalone July report. July was the month our sister sites, try-mahjong.com and try-sudoku.com, finished redirecting here, and we wanted a clean month before we compared anything. August is that month. July’s numbers are in this report as the comparison, so nothing is lost.
Two things changed in August. Mobile play is now a much smaller share of the site than it was in spring. And a large batch of new games arrived, from Hearts to Cribbage, that had never been on TrySolitaire before.
Here’s what 147,673 games told us.
The Big Number
147,673 games started. 55,549 won. 37.6% overall win rate.
That’s up 25% on July’s 117,696. The true growth is smaller than that. July’s redirects took full effect on July 20, and the last twelve days of July ran at about 4,200 games a day. August averaged 4,764. On a like-for-like daily basis, the site grew about 13%.
The win rate held. July was 38.2%. Both are well above the 32.6% we reported in May, and that jump happened before July, not during August.
Within the month, week one averaged 4,391 games a day and week four averaged 5,207. Steady climb, no spikes. The final week ran at 5,417 a day, which is the pace going into September.
Game Popularity
| Game | August | July | Change |
|---|---|---|---|
| Klondike | 66,601 | 51,282 | +30% |
| Spider | 22,775 | 17,901 | +27% |
| FreeCell | 19,738 | 22,820 | −14% |
| Mahjong | 13,583 | 10,586 | +28%* |
| TriPeaks | 4,920 | 2,296 | +114% |
| Golf | 4,307 | 3,171 | +36% |
| Pyramid | 3,453 | 3,129 | +10% |
| Sudoku | 2,168 | 1,124 | +93%* |
| 2048 | 1,680 | 1,796 | −6% |
| Russian | 1,108 | 648 | +71% |
| Eight Off | 730 | 206 | +254% |
| Forty Thieves | 504 | 159 | +217% |
| Scorpion | 320 | 171 | +87% |
| Spiderette | 222 | 37 | — |
| Yukon | 210 | 281 | −25% |
| Double Klondike | 206 | 47 | — |
| Canfield | 81 | 131 | −38% |
*Mahjong and Sudoku comparisons are inflated by the sister-site redirect. Until July 19, players on try-mahjong and try-sudoku were counted separately. From July 20 they all count here. Some of that “growth” is players moving between columns.
Klondike is 45% of all play, flat on July’s 44%. After falling from 81% in April to 61% in May, its share has settled.
FreeCell fell 14%. It’s the first decline for FreeCell since February, and it comes after a run where it grew ten-fold in a single month. 19,738 games is still the third-highest volume on the site. We’ll see whether July was a peak or August was a dip.
Klondike Draw 3 is growing faster than Draw 1. Draw 3 games nearly doubled, from 10,534 to 19,864, while Draw 1 grew 15%. Draw 3 is now 30% of Klondike, up from 21% in July. Nothing changed in the game. More of the players arriving prefer the harder version.
TriPeaks doubled. After sliding through the spring, it went from 2,296 to 4,920. Eight Off and Forty Thieves both more than tripled from small bases.
Win Rates
Win rate is wins divided by total starts. Abandoned games count as non-wins. Both months here are on the same tracking, so the comparison is clean.
| Game | August | July | Change |
|---|---|---|---|
| Eight Off | 86.0% | 85.4% | +0.6pp |
| Spider 1-suit | 59.4% | 52.3% | +7.1pp |
| FreeCell | 58.1% | 56.8% | +1.3pp |
| Mahjong (Turtle) | 52.7% | 61.5% | −8.8pp* |
| Sudoku (all levels) | 46.9% | 41.8% | +5.1pp* |
| TriPeaks | 35.8% | 36.9% | −1.1pp |
| Klondike Draw 1 | 35.3% | 33.3% | +2.0pp |
| Spider 2-suit | 33.0% | 23.3% | +9.7pp |
| Pyramid | 32.4% | 34.2% | −1.8pp |
| Spider 4-suit | 24.2% | 27.3% | −3.1pp |
| Spiderette | 23.9% | — | — |
| Double Klondike | 17.5% | — | — |
| Klondike Draw 3 | 15.5% | 13.9% | +1.6pp |
| Golf | 13.1% | 11.6% | +1.5pp |
| Forty Thieves | 4.8% | 0.0% | +4.8pp |
| Scorpion | 4.4% | 4.1% | +0.3pp |
| Canfield | 3.7% | 2.3% | +1.4pp |
| Russian | 3.3% | 2.9% | +0.4pp |
| Yukon | 1.4% | 0.7% | +0.7pp |
| 2048 | 0.8% | 0.6% | +0.2pp |
*Mahjong and Sudoku picked up the sister-site players on July 20. The August player pool is different from the July one, so we’re not reading these moves as players getting better or worse.
Eight Off tops the table at 86.0%. It’s the first month Eight Off has enough volume to report on with confidence, and it beats FreeCell, the game it most resembles, by 28 points. Eight Off gives you eight free cells instead of four. That extra room is the whole difference. More on Eight Off in the spotlight below.
Klondike is up on both settings. Draw 1 rose two points to 35.3% on 46,737 games. Draw 3 rose 1.6 points to 15.5% on 19,864. With samples that size, both moves are real. The Draw 1 rate was 28.1% in May. It has climbed every month since.
Spider moved a lot, and it’s a mix story. 1-suit is up seven points and 2-suit is up ten. 4-suit is down three. At the same time, 2-suit’s share of Spider play fell from 30% to 19% while 4-suit’s rose from 10% to 14%. The likely read: players who were winning at 2-suit moved up to 4-suit. That leaves 2-suit with a pool that finishes more often, and 4-suit with more newcomers who don’t. No changes were made to Spider in August.
Forty Thieves recorded its first wins since June — 24 out of 504. In July it went 0 for 159.
Four games are held out of the table this month while we check their win recording: Canasta, Parallels, and the Mahjong Arrow and Eagle layouts all showed zero or near-zero wins on samples where that shouldn’t happen.
Where the Games Go: Won, Lost, Abandoned
Site-wide, across every game with 50 or more starts:
| August | July | |
|---|---|---|
| Won | 37.7% | 38.2% |
| Lost | 7.8% | 8.1% |
| Abandoned | 54.4% | 53.6% |
The mix of games moved a lot in August. The outcomes didn’t. Every line is within a point of July.
As we explained in May, abandonment means different things in different games. In open-ended games like Klondike, the board never tells you you’ve lost. You leave. In forced-ending games like Golf, the game ends itself when you run out of moves. So the abandon rate only says something about player behavior within each type.
Open-ended games:
| Game | August | July | Change |
|---|---|---|---|
| Eight Off | 14.0% | 14.6% | −0.6pp |
| FreeCell | 41.8% | 43.2% | −1.4pp |
| Spider | 50.2% | 58.9% | −8.7pp |
| Sudoku | 53.1% | 58.2% | −5.0pp |
| Klondike | 70.6% | 70.7% | −0.1pp |
Klondike’s abandon rate did not move. 70.7% to 70.6%, on 118,000 combined games. That number is now a fixed feature of the site: seven in ten Klondike games get opened and left.
Spider dropped nearly nine points. That fits its win-rate gains. Fewer players walked away, and more of them finished.
Eight Off is the stickiest game we have. Six in seven starts get played to the end.
Forced-ending games went the other way, all five of them:
| Game | August | July | Change |
|---|---|---|---|
| Golf | 16.6% | 10.1% | +6.5pp |
| TriPeaks | 16.7% | 12.1% | +4.6pp |
| Pyramid | 29.2% | 16.0% | +13.2pp |
| Mahjong | 32.1% | 21.6% | +10.4pp |
| 2048 | 44.0% | 28.7% | +15.3pp |
In these games, abandoning means quitting before the game ends on its own. Five games, five increases, some of them large. We don’t have an explanation yet. When five unrelated games move the same way in the same month, it usually points to one shared cause — a change in who’s arriving, or in how the games load — rather than five separate ones. We’ll be looking at this in September.
Speed & Efficiency
Average duration and moves across all August games with timing data. Games where more than 5% of plays ran over an hour (Sudoku, 2048, Scorpion) have their durations excluded, because tabs left open in the background inflate those averages.
| Game | Avg Duration | Avg Moves |
|---|---|---|
| Spider | 23 min | 98 |
| Mahjong | 17 min | 66 |
| Pyramid | 10 min | 58 |
| Klondike | 9 min | 50 |
| FreeCell | 8 min | 76 |
| Forty Thieves | 8 min | 126 |
| Eight Off | 7 min | 95 |
| Golf | 5 min | 46 |
| TriPeaks | 4 min | 47 |
| Sudoku | — | 41 |
| 2048 | — | 423 |
Klondike’s 50-move average across all games is a long way below the 92 moves its winners average. That gap is the abandon rate showing up in a different form: most Klondike games end early.
Winners vs. Non-Winners
| Game | Outcome | Games | Avg Moves | Avg Time | Avg Undos |
|---|---|---|---|---|---|
| Klondike | Winners | 19,589 | 92 | 9.6 min | 1.4 |
| Spider | Winners | 11,292 | 131 | 21 min | 5.3 |
| FreeCell | Winners | 11,456 | 104 | 8.8 min | 0 |
| Mahjong (all layouts) | Winners | 5,731 | 72 | 15.8 min | 0.2 |
| Mahjong (all layouts) | Non-winners | 3,540 | 64 | 16.3 min | 0.2 |
| Sudoku | Winners | 1,014 | 47 | 22 min | 1.1 |
| TriPeaks | Winners | 1,758 | 48 | 3.8 min | 0.5 |
| TriPeaks | Non-winners | 2,333 | 48 | 3.4 min | 0.5 |
| Pyramid | Winners | 1,119 | 71 | 4.8 min | 0 |
| Pyramid | Non-winners | 1,328 | 53 | — | 0.4 |
| Eight Off | Winners | 628 | 97 | 7.0 min | 0 |
| Golf | Winners | 563 | 54 | 5.9 min | 0.1 |
| Golf | Non-winners | 3,029 | 46 | 4.6 min | 0.7 |
Open-ended games rarely record a completed loss, so Klondike, Spider, and FreeCell show winners only.
Klondike winners are the same people they were in February. 92 moves, under ten minutes, 1.4 undos. That profile has barely changed across seven months and a twenty-fold increase in volume.
FreeCell and Eight Off winners both use zero undo. These are the two games on the site where nearly every deal can be solved, and their winners play them the same way: think, then move.
Pyramid and Golf non-winners still use more undo than winners. In Pyramid, 0.4 versus 0. In Golf, 0.7 versus 0.1. That pattern has held since March. In these games, backing up doesn’t seem to rescue a game that’s going wrong.
Sudoku winners used 0.5 hints per game, down from 1.3 in April. Sudoku remains the only game on the site where hints get used at all.
Pyramid non-winners’ duration is excluded this month. It read 15 minutes, against 3–4 minutes in every earlier month, and we suspect open tabs.
Mobile vs. Desktop
| August | July | April | |
|---|---|---|---|
| Desktop share | 85.5% | 84.3% | 75.8% |
| Mobile share | 14.5% | 15.7% | 24.2% |
Mobile is now about one play in seven. In March it was one in three. The shift is confirmed by two separate data sources that agree within a few points, so it’s not a counting error on one table. Part of it is the audience: the site has picked up a large desktop-heavy player base since spring. We’re also checking whether anything changed in how we detect devices, and we’ll say so if it did.
Mobile share by game: Russian 46%, 2048 41%, Sudoku 33%, Golf 27%, Klondike 21%, FreeCell 12%, Spider 11%, Mahjong 11%, Pyramid 8%, TriPeaks 4%.
Win rate by device (games with 50+ starts on both devices):
| Game | Desktop | Mobile | Gap |
|---|---|---|---|
| Klondike | 25.4% | 27.6% | mobile +2.2 |
| Spider | 40.5% | 51.5% | mobile +11.0 |
| FreeCell | 53.8% | 38.9% | desktop +14.9 |
| Sudoku | 32.8% | 22.6% | desktop +10.2 |
| Mahjong (all layouts) | 25.6% | 12.4% | desktop +13.2 |
| Golf | 12.3% | 10.7% | desktop +1.6 |
| Pyramid | 29.0% | 8.1% | desktop +20.9 |
| TriPeaks | 33.6% | 8.4% | desktop +25.2 |
These rates include games opened with no move made, so they read a few points lower than the win-rate table above. The gaps between devices are the point.
A correction to our April post. In Mobile vs Desktop: Who Wins More? we reported mobile players winning Klondike Draw 1 by 21 points. That was a two-week sample right after a tracking fix. On 75,704 Klondike games in August, the mobile edge is two points. Spider’s mobile edge is real and holding at 11 points. The Klondike finding was too strong, and we’re marking that post accordingly.
Desktop wins every game where you scan a board for matches or numbers — Mahjong, Sudoku, Pyramid, TriPeaks. Mobile wins the two games where you build long sequences, Klondike and Spider. Screen size seems to matter for the scanning games and not for the building ones.
Pyramid and TriPeaks on mobile are a problem. 8% win rates against 29–34% on desktop. Both are tap-to-match games with small targets, and the gap is far too big to be about who’s playing. We think it’s the touch experience, and we’re looking at it.
New This Month
A batch of new games arrived during August: Hearts, Skat, Belote, Spades, Whist, Rummy 500, Euchre, Cribbage, Gin Rummy, and more than thirty lesser-known solitaire variants. These are single-player versions. Twelve cleared 50 starts in their first partial month.
| Game | Starts | Win Rate |
|---|---|---|
| Hearts | 234 | 12.8% |
| Skat | 229 | 6.1% |
| Belote | 183 | 20.8% |
| Spades | 82 | 4.9% |
| Whist | 77 | 13.0% |
| Rummy 500 | 75 | 24.0% |
| Euchre | 61 | 3.3% |
| Queen’s Audience | 58 | 22.4% |
| Cribbage | 57 | 1.8% |
| Gin Rummy | 50 | 4.0% |
Across all the new games, 79% of starts were abandoned. That’s what a first month looks like: people open a game to see what it is, and most leave. We’ll report on these properly once they have a full month and a settled player base. No month-over-month until then.
Spotlight: Eight Off
Eight Off is a FreeCell cousin. Same idea — every card face up, build down in the tableau, use free cells to park cards — but with eight free cells instead of four and building by suit instead of by alternating color.
In August it had the highest win rate of any card game on the site (86.0%) and the lowest abandon rate (14.0%). 628 wins from 730 starts. Winners took 97 moves and seven minutes, with zero undo.
Compare FreeCell: 58.1% win rate, 41.8% abandoned. Same family, four fewer cells, and players are three times as likely to walk away. Those four extra cells turn a game you have to think through into a game you can mostly play through.
If FreeCell frustrates you, this is the one to try. Play Eight Off →
What’s Next
September brings the seventh monthly report, and the second on fully clean data.
Coming posts:
- FreeCell: a full data portrait — the game’s first decline is a good moment to look at what four months of growth built.
- Does using undo actually help you win? — July and August give us two clean months across every game.
The most-played game in August was Klondike, with Draw 3 gaining ground. Play it here →
All data is anonymous. TrySolitaire does not track individual users. Win rates are calculated as wins divided by total starts, treating abandons as non-wins. Games with fewer than 50 starts in a month are excluded from win-rate tables. Word and memory games are excluded from solitaire tables. Mahjong win rate is for the Turtle layout only; Mahjong allows up to 5 reshuffles by default, which raises its win rate relative to games without that option. Mahjong and Sudoku month-over-month figures are affected by the sister-site redirect completing on July 20, 2026. Canasta, Parallels, and the Mahjong Arrow and Eagle layouts are excluded pending a check on win recording. Durations are averaged over games with timing data; games where more than 5% of plays exceeded one hour have durations excluded. Device win rates include games with no moves made. Data covers August 1–31, 2026. See our June 2026 report for the previous report. For game rules and strategy, see our Klondike Solitaire Guide, FreeCell Guide, and Spider Solitaire Guide.
Published September 1, 2026 | TrySolitaire Blog · Play Free Solitaire